Dashboard
- Copy Page Tree
- Ben Hoffman
The Dashboard provides visibility into past, present, and future build, deployment and test automation activities across all of FlexDeploy.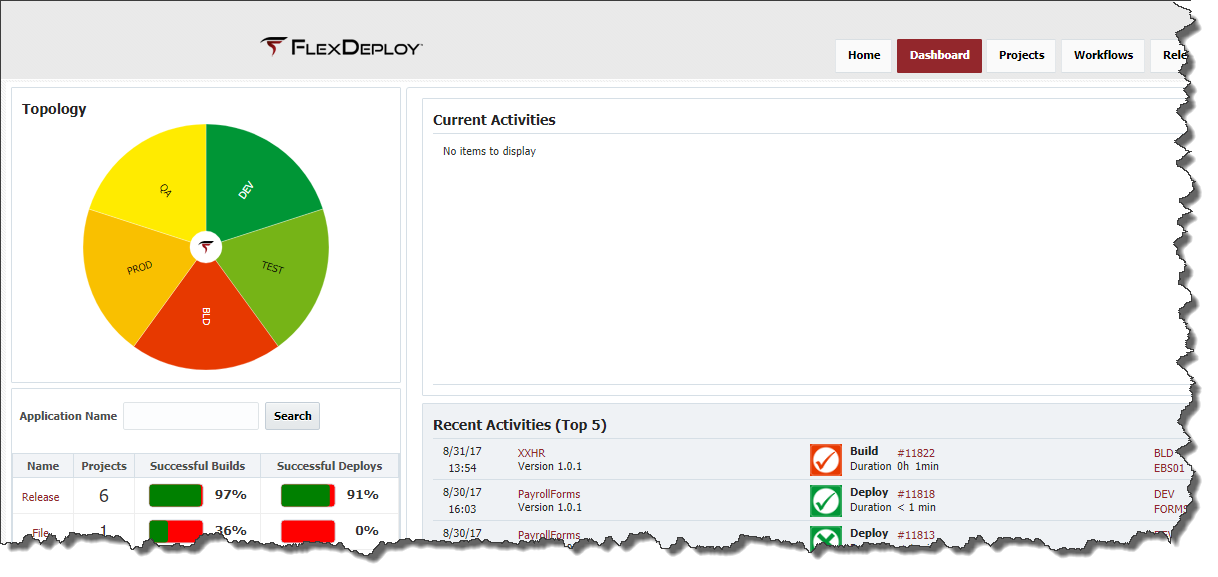
At the top left of each tab is a sunburst data visualization component representing the configured environments and instances (depicted above). This component offers data filtering functions to narrow the results displayed on each tab.
To filter the displayed data to a specific environment, click on the partition representing the desired environment. To filter the display to a specific instance within an environment, first double-click on an environment. This drill-down attribute will then populate a new sunburst with the corresponding instances associated to that environment, as shows below. Then click on the desired instance to display the data only pertaining to that individual environment and instance.
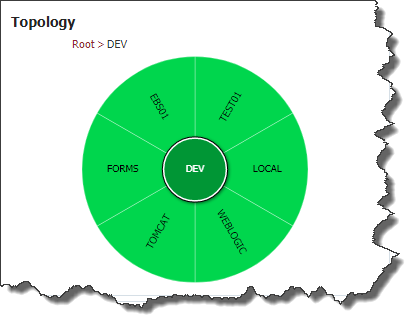
To return to the original sunburst, click on the Root link in the path at the top of the section. To restore the display data to all environments throughout the system, click on the center circle in the sunburst containing the FlexDeploy logo.
The other section that appears in all of the tabs on the Dashboard is the application table, on the bottom left of the screen (shown below). This table displays each active application in the system and its success rate for both builds and deployments. To filter the applications enter all or part of an application name and click the Search button. Click on an application to navigate to that application within the Project Explorer page.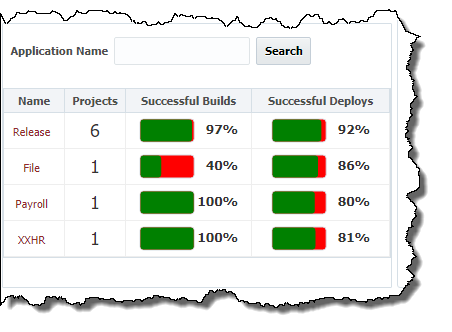
The table below defines the meaning of the different images displayed on the Dashboard.
Image | Description |
|---|---|
| A project has above a 60% build/deploy success rate over the last 10 executions. |
| A project has a build/deploy success rate between 30% and 60% over the last 10 executions. |
| A project has below a 30% build/deploy success rate over the last 10 executions. |
| A project build or deployment execution completed successfully. The color matches to the corresponding environment. |
| A project build or deployment execution failed. The color matches to the corresponding environment. |
| A build is currently being performed on a project. |
| A deployment currently is being performed on a project. |
Dashboard Details
- style