The Dashboard provides visibility into currentpast, pastpresent, and future build, deployment and test automation activities across the all of FlexDeploy environments and instances.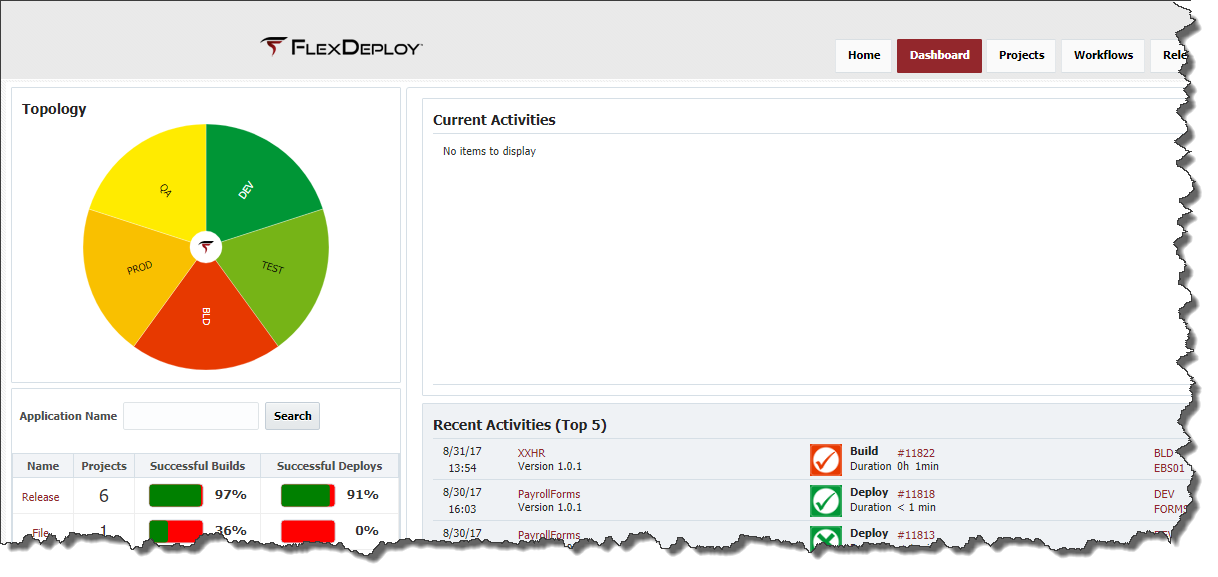
At the top left of each tab is a sunburst data visualization component representing the configured environments and instances (depicted above). This component offers data filtering functions to narrow the results displayed on each tab.
...
To return to the original sunburst, click on the 'Root' link in the path at the top of the section. To restore the display data to all environments throughout the system, click on the center circle in the sunburst containing the FlexDeploy logo.
The other section that appears in all of the tabs on the Dashboard is the application table, on the bottom left of the screen (shown below). This table displays each active application in the system and its success rate for both builds and deployments. To filter the applications enter all or part of an application name and click the Search button. Click on an application to navigate to that application within the Project Explorer page.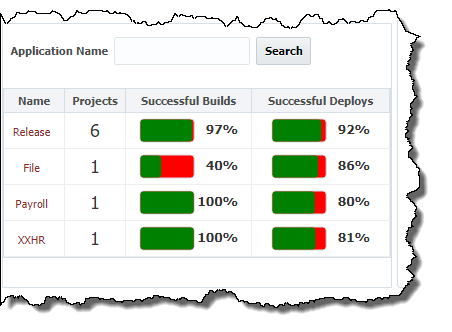
The table below defines the meaning of the different images displayed on the Dashboard.
...