The Test Automation tab displays historical information about test automation executions.
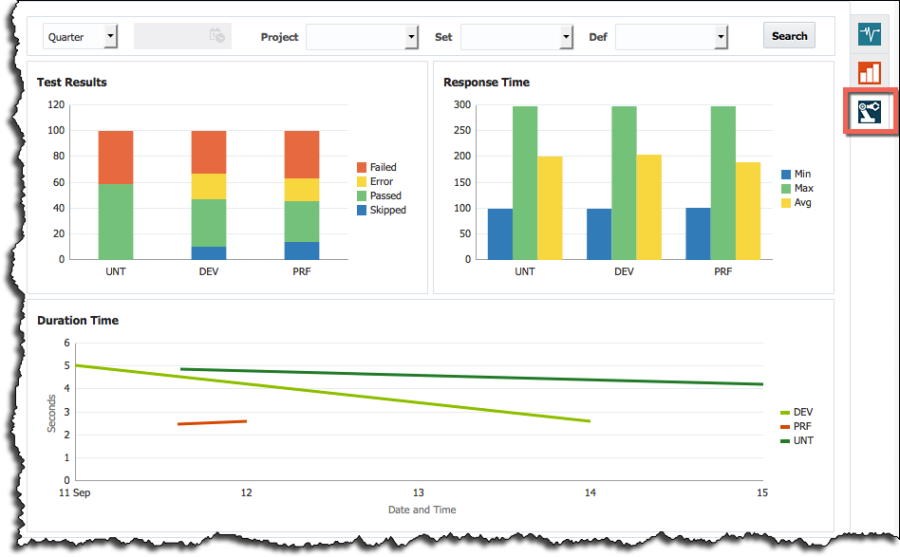 Figure 15.10
The data displayed can be filtered by time range (e.g. Today, Week, Month, Quarter, Year or exact date), by Project, by Test Set (Set) and by Test Definition (Def).
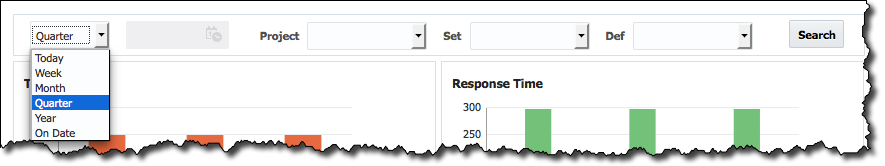
Figure 15.11
Test Results
The Test Results chart displays a bar graph representation of test execution results across environments. Hovering your mouse over the graph will identify the exact percentage corresponding to each test result (such as Passed, Failed, Error and Skipped), and for what environment.
...