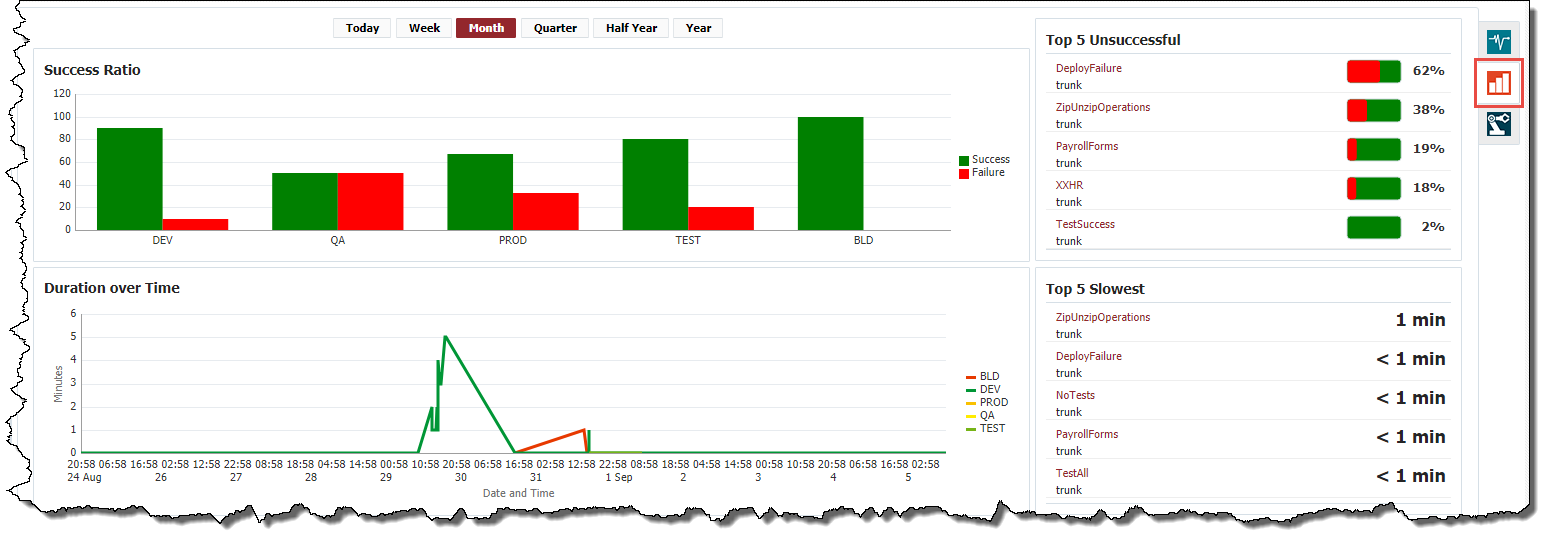
The Statistics tab displays the duration and success rates of builds and deployments by environment.

The time range of the data displayed can be adjusted from one day up to a year, by clicking on the tabs shown below.

Any of the information on this tab can be filtered through the drill-down and filter functions of the topology sunburst component.

The section across the bottom of this tab summarizes the successful and failed builds and deploys, according to the filters selected on the page.
![]()

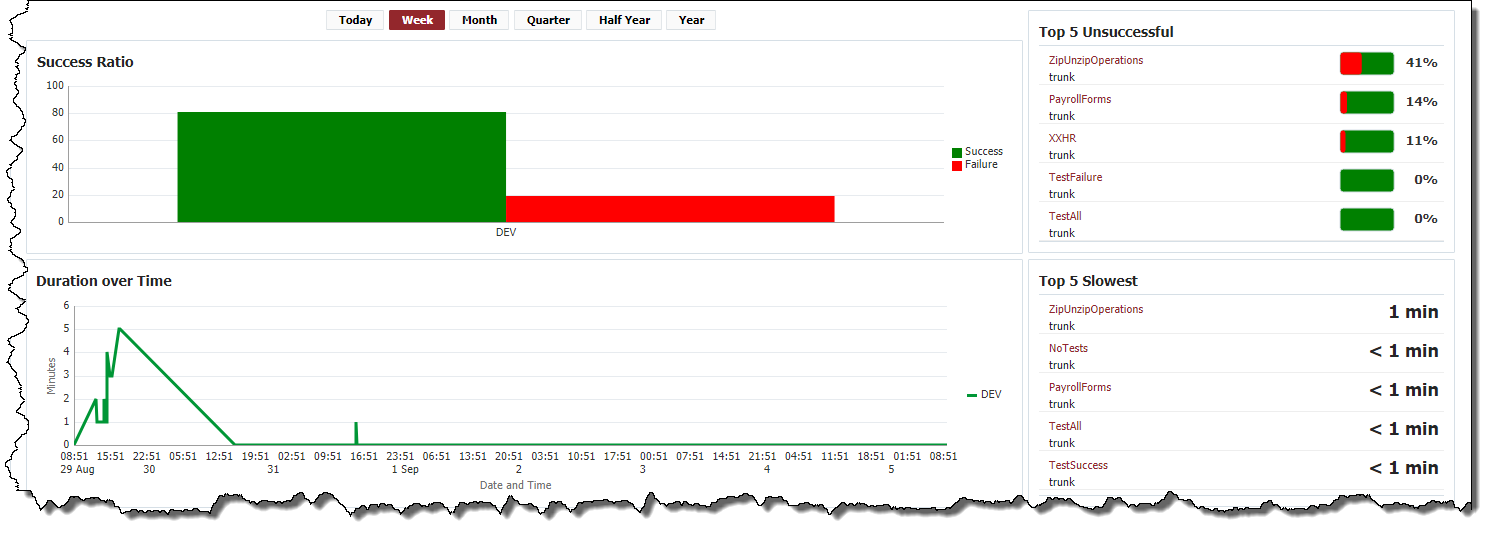
Success Ratio
The Success Ratio section displays a bar graph representation of the successful and failed executions to an environment. Hovering your mouse over the graph will identify the exact percentage corresponding to each column, and for what environment.
...