...
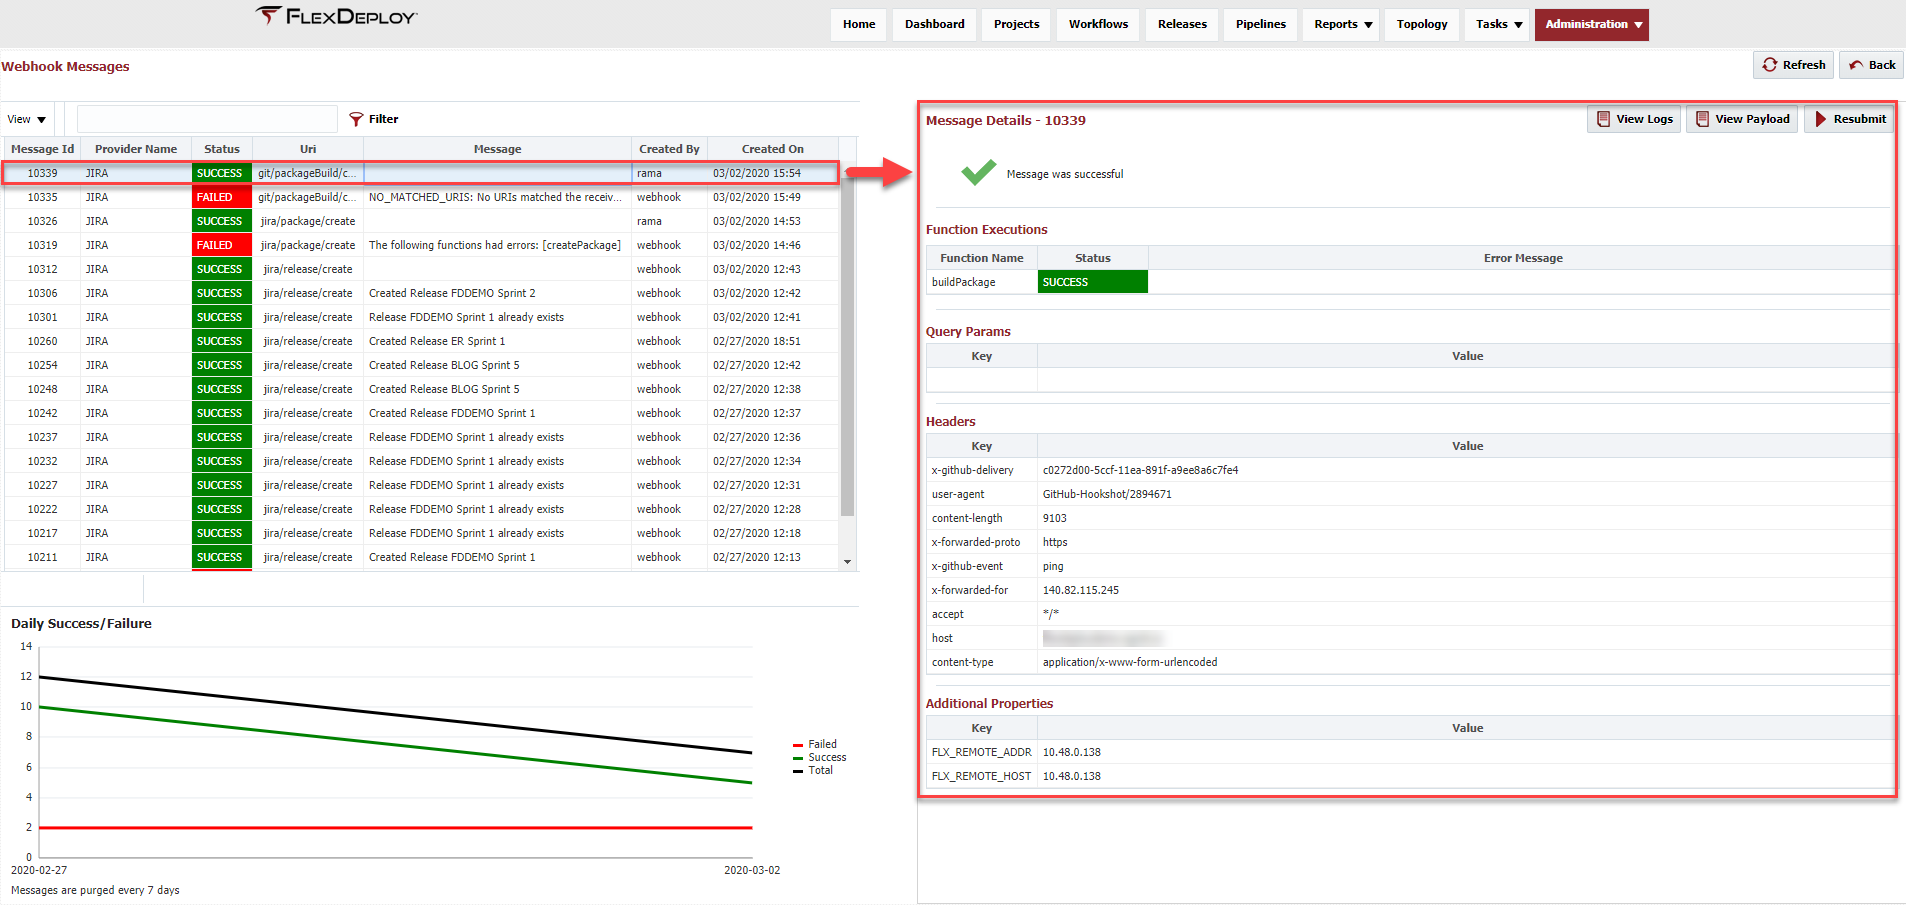
Click on any webhook message row in the table to view more details about an individual message. This will show more detail about the execution, including any webhook functions which were executed from this trigger and their statuses, as well as more context about the incoming webhook, including query parameters, headers, and additional properties.
Click  to view the entire JSON POST payload as received from the provider. More information on the execution can be viewed by clicking
  . This will show any log messages printed in function scripts using the LOG methods. Click to view the entire JSON POST payload as received from the provider. You can also submit an incoming webhook message to be executed again with the
  button. Keep in mind this is only meant to be used for debugging purposes. There is a Global Permission defined on groups to control who is allowed to resubmit webhook messages.
Log Messages
Some logs are printed automatically during execution, but most are printed by using the LOG methods in the provider match and function scripts. By default, the logging level will be based on the global FlexDeploy logging level. This can be modified specifically for webhook logs by setting the logging level for flexagon.fd.services.webhooks.functions.LogFunctions in Admin → Admin Operations.
...